What a battery has to work with: day-ahead price spreads in ten European markets
A battery earns most of its revenue on the spread in electricity pricing across a day. We measured that gap across ten European markets for the whole of 2025 to determine the countries which should, in principle, be the most lucrative for battery storage.
Key findings
- A battery earns on the gap between the cheapest and most expensive hour of a day, so we measured that gap in ten European markets across the whole of 2025.
- The widest daily spreads are in the Netherlands at 116 euros per MWh and Germany at 112. The narrowest are in Italy at 59 and Great Britain at 67.
- Wide spreads generally come from a lot of solar pushing the middle of the day towards zero while gas still sets the price in the evening. Flat markets are either priced by gas around the clock, as Italy is, led by wind rather than solar, as Great Britain and Ireland are, or already arbitraged by existing storage, as Switzerland is.
- A high price and a wide spread are different things. Italy has the most expensive electricity of the ten and the least to trade against.
- As we discuss in more detail in our article on wholesale pricing for independent aggregators, the markets with the most to earn are largely the ones where an independent aggregator cannot reach the wholesale price at all.
What was measured
While there are other sources of revenue such as fast frequency response and peak demand shaving, the figure that generally decides whether storage is worth building is the daily spread: the highest price of a local day minus the lowest. We took the 2025 day-ahead year for every market.1 Some of these markets price electricity by the hour and others by the quarter hour. Every market was therefore averaged to whole hours first, and the spread of each local day measured from that.
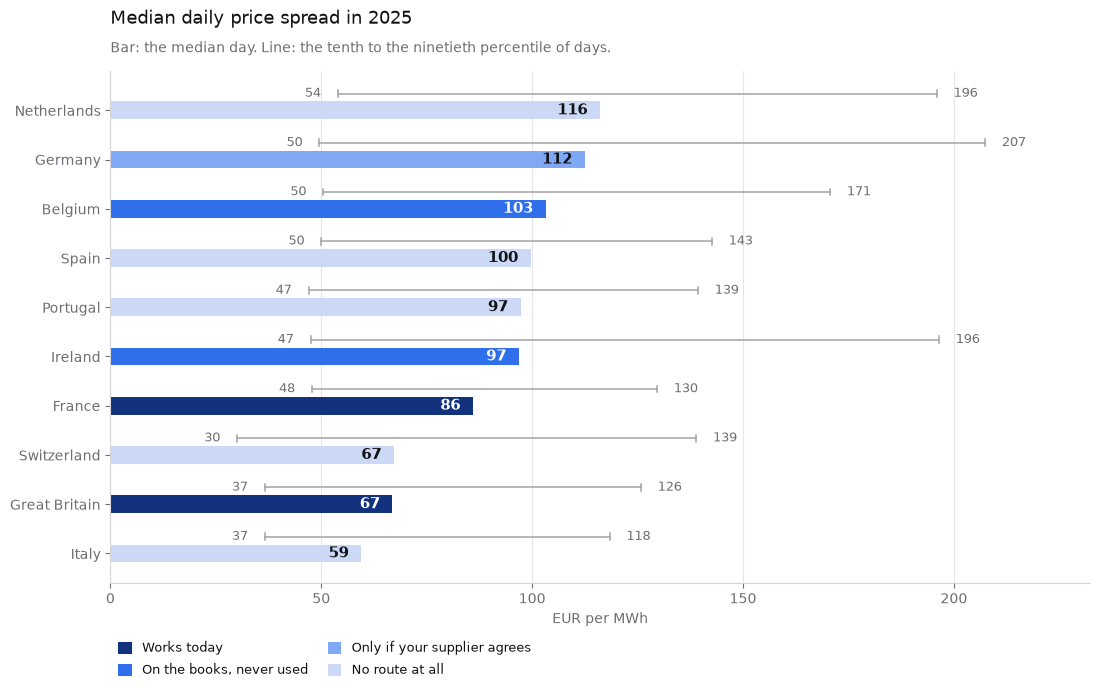
As well as demonstrating the daily spread in pricing across 10 European countries, the chart indicates whether an independent aggregator is allowed to sell a site's flexibility into the wholesale market, which decides whether a behind-the-meter battery can reach these prices at all without moving the whole site onto a pass-through supply contract. Only Great Britain and France have an operational route, and both sit in the narrower half of this chart. The rules behind those four categories are the subject of a companion piece on P415 and its equivalents across Europe.
| Market | Mean price (EUR/MWh) | Median daily spread (EUR/MWh) | Widest tenth of days (EUR/MWh) | Quietest tenth of days (EUR/MWh) | Hours below zero |
|---|---|---|---|---|---|
| Netherlands | 86.81 | 116.10 | 195.94 | 53.91 | 584 |
| Germany | 89.32 | 112.46 | 207.38 | 49.56 | 576 |
| Belgium | 82.57 | 103.19 | 170.63 | 50.46 | 519 |
| Spain | 65.29 | 99.64 | 142.62 | 50.01 | 556 |
| Portugal | 66.18 | 97.26 | 139.30 | 46.98 | 200 |
| Ireland | 114.35 | 96.84 | 196.44 | 47.46 | 58 |
| France | 61.08 | 85.97 | 129.60 | 47.78 | 513 |
| Switzerland | 101.69 | 67.24 | 138.89 | 30.05 | 303 |
| Great Britain | 93.18 | 66.88 | 125.77 | 36.60 | 238 |
| Italy | 115.86 | 59.48 | 118.36 | 36.59 | 0 |
Why the spreads differ
The Netherlands, Germany and Belgium share a similar shape as each country has built enough solar to push the middle of the day towards zero across several months of the year, and they still need gas in the evening once the solar subsides. Dutch prices fell below zero in 584 hours of 2025 and German prices in 576. Gas plants largely stay on through those hours, because stopping and restarting costs more than paying to run, losing money at midday and then going on to set a high price at dusk. The more solar goes onto the system, the deeper the trough and the wider the gap.
Spain and Portugal have the same shape and the lowest prices. Their midday troughs are the deepest of the ten, at 41.9 and 44.9 per cent of their own annual averages, and Portugal generated 68 per cent of its electricity from renewables in 2025. What keeps the level low is that Iberia is only weakly connected to the rest of Europe, so cheap Iberian power largely stays in Iberia instead of flowing out to more expensive markets. In 2025 Portugal and Spain settled at exactly the same price in 89 per cent of hours. The two countries are joined by nine high-voltage overhead lines, which through 2025 carried roughly 3,200 MW westwards into Portugal. When Spanish solar produces more surplus than those lines can take, the excess has nowhere to go, so the Spanish price keeps falling while the Portuguese price remains static. For this reason, Spain experienced 556 negative hours in 2025 compared to 200 in Portugal. A tenth line, a 400 kV double circuit running from Galicia into northern Portugal, opened on 2 July 2026 and added another 1,000 MW, so this particular gap is likely to narrow in the future.
France is the cheapest of the ten at 61.08 euros per MWh, because nuclear and hydro cover most hours at a low marginal cost. Its spread is still healthy at 85.97 euros, since French solar now digs a midday trough to 51.6 per cent of the mean.
In Italy, gas is the marginal technology and thus sets the price of electricity in roughly seven hours in ten, so an imported fuel price sets the Italian electricity price almost around the clock. That produces the highest level of the ten and the flattest curve with it: a midday trough that only reaches 78.9 per cent of the mean, and zero hours of negative pricing. Expensive and flat is the least promising combination for a battery. That figure comes from the northern zone, which is where most Italian industry sits, so it is worth asking whether it speaks for the country. Italy has been split into seven bidding zones since January 2021, and in 2025 all seven cleared at a common price in only 67 per cent of hours. Measured on the same basis, their median daily spreads range from 59.48 euros in the north to 77.34 in Sardinia, so the north is in fact the flattest of the seven and the figure quoted here is the most conservative available. The conclusion holds everywhere regardless: every Italian zone averaged between 112 and 117 euros per MWh, every one has its cheapest hour at 13:00 with the dip reaching no lower than 68 per cent of its own mean, and not one hour of 2025 in any of the seven was priced below zero. Even Sardinia, the most volatile of them, would rank only eighth of the ten markets in this article.
Ireland has a great deal of wind, but the system operator caps non-synchronous generation at 75 per cent of demand, so when wind is abundant it is curtailed and gas is kept running to hold the system together. Around an eighth of Ireland's available wind did not reach customers in 2025. That keeps the price high and stops it falling through the floor, with only 58 hours below zero in 2025.
Likewise, Great Britain runs on wind rather than solar, which is why its cheapest hour is 04:00 and its midday dip is relatively shallow. Wind does not follow the clock the way solar does, so it flattens the average day instead of carving a hole in the middle. Gas still sets the price in most hours, which flattens the curve further.
In Switzerland there is more than 4 GW of pumped storage, a fleet whose whole business is buying in cheap hours and selling in expensive ones. Doing that at scale compresses the spread a new battery would be chasing, which is why Switzerland pairs the third highest price of the ten with the narrowest range of any market analysed, at 30.05 euros.
The shape of the day
| Market | Cheapest hour | Price then | Most expensive hour | Price then |
|---|---|---|---|---|
| Italy | 13:00 | 78.9% | 19:00 | 124.8% |
| Great Britain | 04:00 | 82.0% | 18:00 | 125.0% |
| Switzerland | 13:00 | 66.2% | 19:00 | 129.4% |
| Ireland | 04:00 | 74.7% | 18:00 | 137.9% |
| Belgium | 13:00 | 49.9% | 19:00 | 149.3% |
| Netherlands | 13:00 | 48.9% | 19:00 | 150.9% |
| Germany | 13:00 | 51.5% | 19:00 | 152.5% |
| France | 14:00 | 51.6% | 19:00 | 156.1% |
| Portugal | 13:00 | 44.9% | 20:00 | 166.3% |
| Spain | 14:00 | 41.9% | 21:00 | 169.3% |
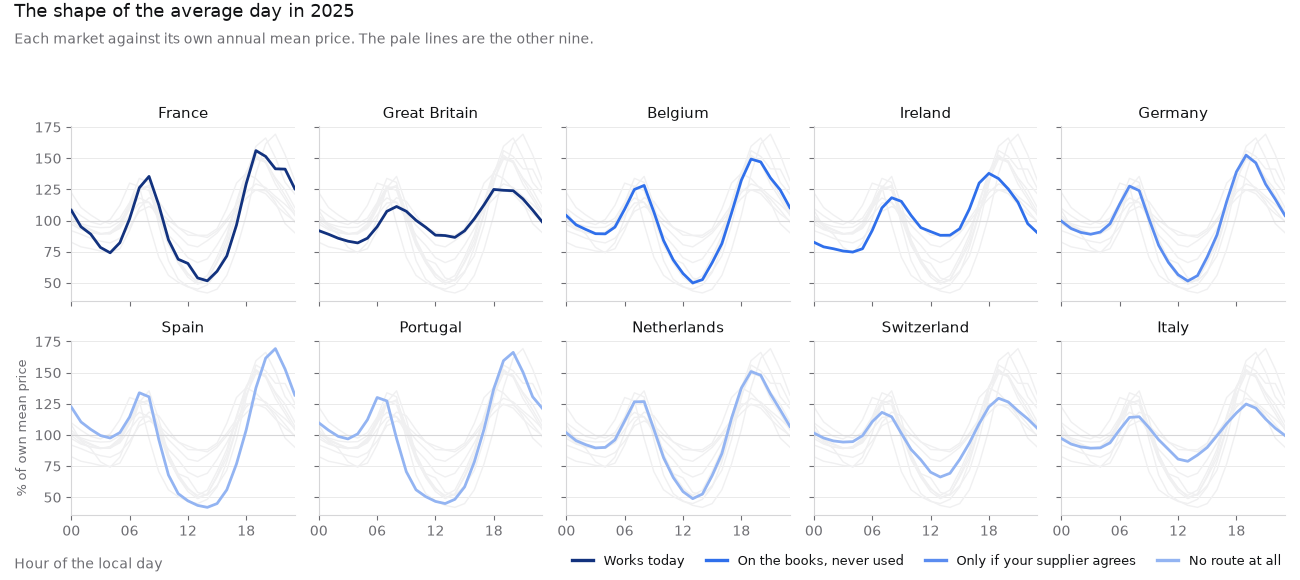
Eight of the ten are cheapest in the early afternoon, when solar output is at its highest, and at their most expensive in the evening once it has gone. Spain has the most pronounced version of both: its 14:00 hour averages 41.9 per cent of the Spanish annual mean price and its 21:00 hour 169.3 per cent.
Great Britain and Ireland are the exceptions, cheapest at 04:00, because those two systems run on wind rather than solar. In Great Britain that puts the cheapest hour and the cleanest hour in different places, since GB grid carbon intensity reaches its daily low around the middle of the day.
The practical consequence is that a battery in Spain charges in the afternoon and discharges late in the evening, while one in Great Britain charges overnight and discharges in the early evening.
How does this marry up with the regulatory landscape?
Based on our analysis, the most attractive markets for battery storage should be the Netherlands, Germany and Belgium, closely followed by Spain and Portugal. However, as we discussed in our article on access to wholesale pricing for independent aggregators, only in the UK and France are behind-the-meter battery storage assets able to truly access wholesale pricing without requiring the end-consumer to change their entire tariff structure. The practical consequence is that in most markets, electricity suppliers continue to play an outsized role in determining the viability of behind-the-meter battery storage. Understanding the optimal tariff for you or your tenant is therefore critical. Lupa answers that question for a specific site in any of the markets covered here.
Common questions
Which European market has the widest electricity price spread?
The Netherlands, at a median of 116.10 euros per MWh across 2025, followed by Germany at 112.46 and Belgium at 103.19.
Does a battery need high electricity prices, or a wide spread?
A wide spread. Arbitrage pays on the gap between two hours rather than on the price level, so a market averaging 60 euros with a 120 euro spread is a better place to trade than one averaging 120 with a 60 euro spread. The level matters in two narrower ways: round-trip losses are paid at the prevailing price, and behind a meter the saving comes off a retail bill that follows the wholesale level.
Why is Italian electricity so expensive?
Gas sets the Italian price in roughly seven hours in ten, and Italy imports nearly all of its gas, so the electricity price largely tracks an international fuel price. That also makes the Italian curve the flattest of the ten, because the same technology is setting the price at midday and at midnight.
Why do electricity prices go below zero?
Because solar and wind keep generating when nobody needs the output, and thermal plants often find it cheaper to pay to keep running than to shut down and restart. Dutch prices were below zero in 584 hours of 2025 and German prices in 576.
When is electricity cheapest in Europe?
In eight of these ten markets, in the early afternoon, when solar output peaks. Spain is the most extreme, with its 14:00 hour averaging 41.9 per cent of the Spanish annual mean. Great Britain and Ireland are the exceptions, cheapest at 04:00, because those two systems run on wind rather than solar.
Try Lupa free for sixty days and price your own site in any of these markets
Notes
- The prices are the 2025 day-ahead year for each market from the Fraunhofer ISE Energy-Charts service, except Great Britain. Everything is averaged to whole hours before any spread is taken, because the European day-ahead auctions moved from hourly to quarter-hourly products on 1 October 2025 and a finer series reaches further into each day's extremes. Days are local calendar days. Euro figures for Great Britain use the 2025 average of the European Central Bank reference rate, 0.85679 pounds per euro. Italy is priced in seven zones and for the purposes of this analysis, we have used the Northernmost one as that is where most Italian industry sits. Great Britain is the weakest series of the ten. No free GB day-ahead price exists, because the auctions are run commercially and Great Britain no longer publishes to the European transparency platform, so the figures here are the Elexon Market Index Price, an index of trades that closely but not perfectly reflects delivery price. ↩